Ladder Rank Salary Data
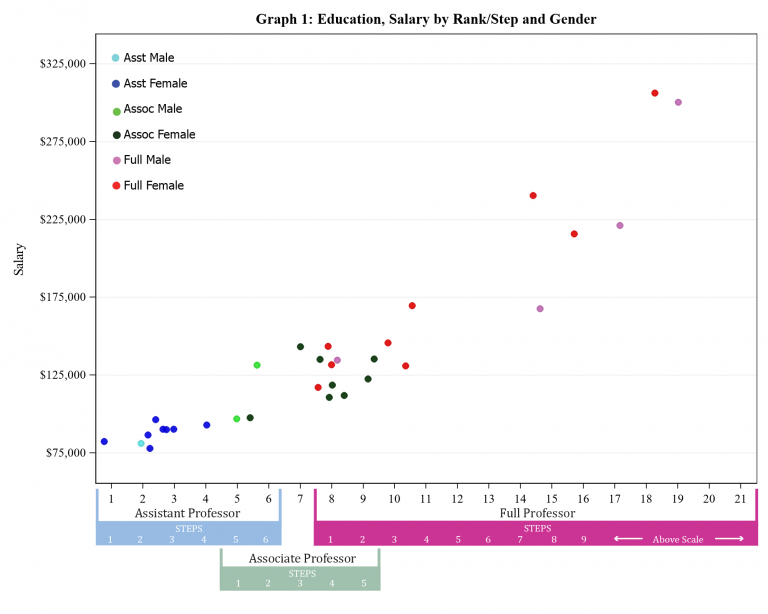
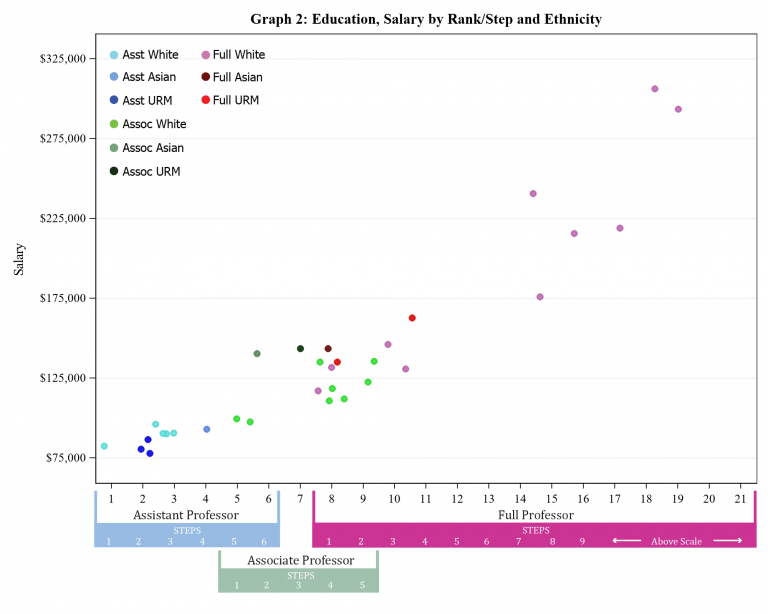
The salary data for all Education Ladder Rank Faculty, are plotted below.
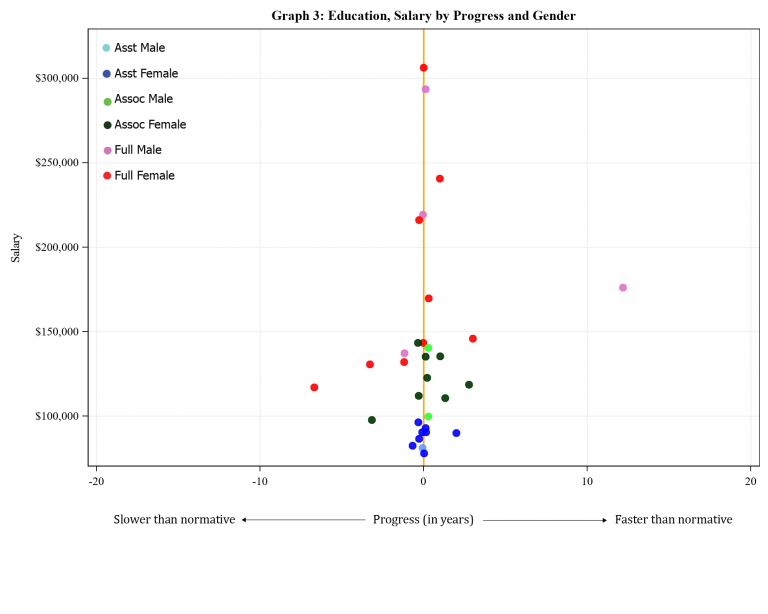
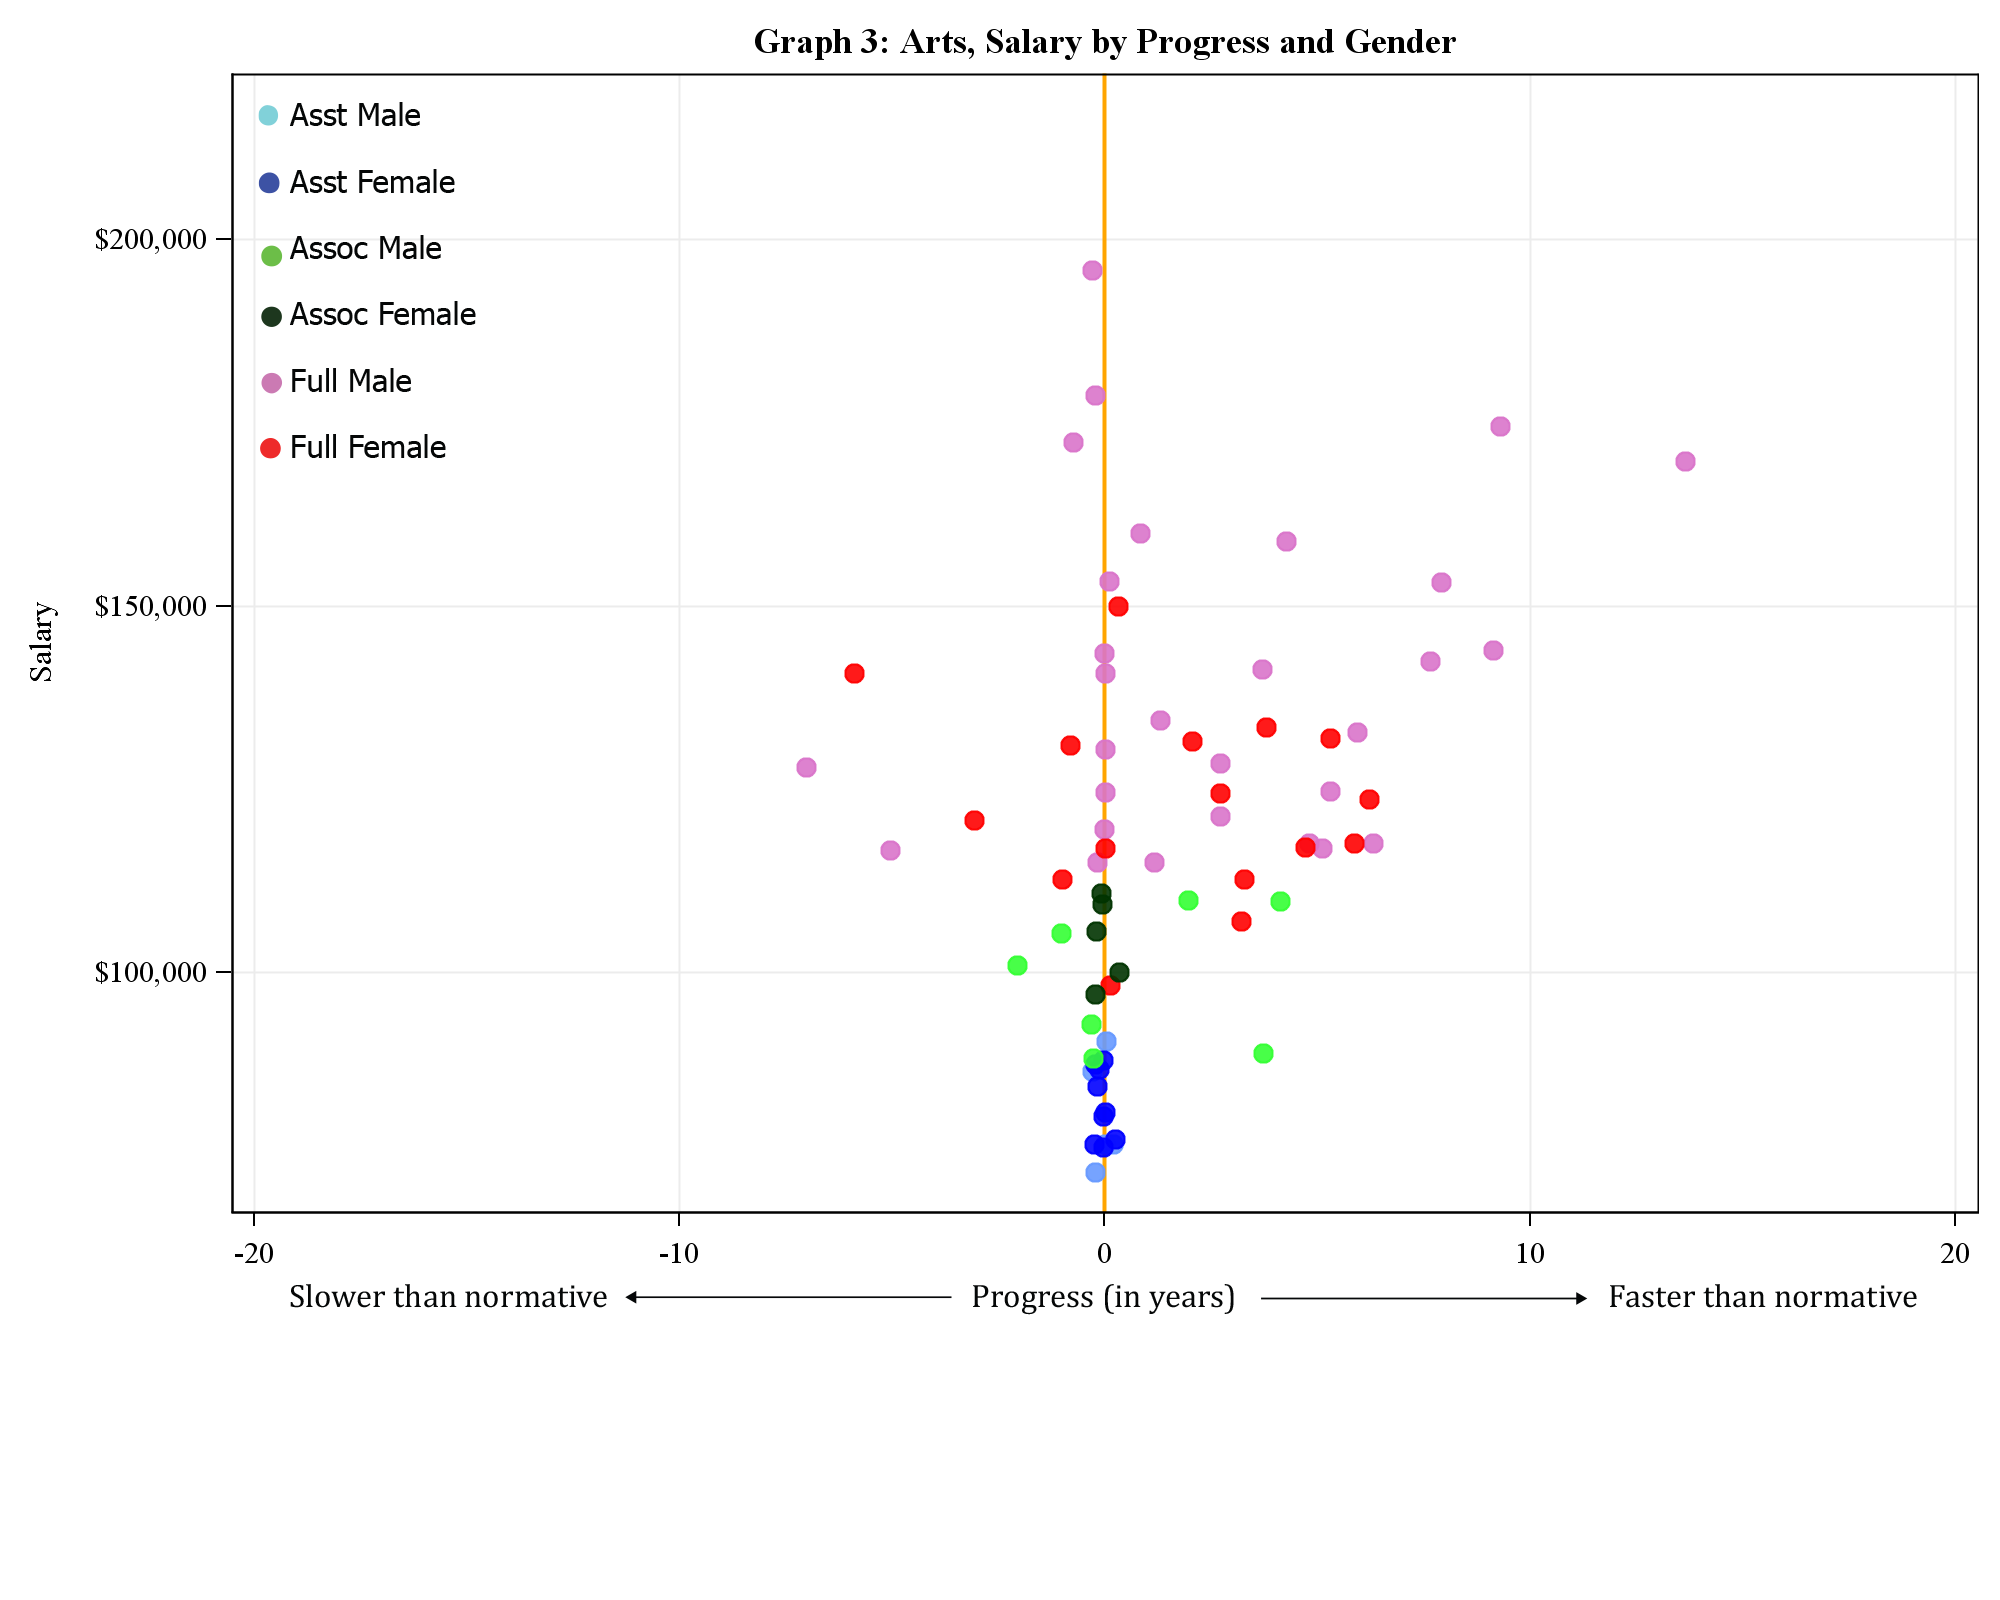
As a function of rank, step, and gender:
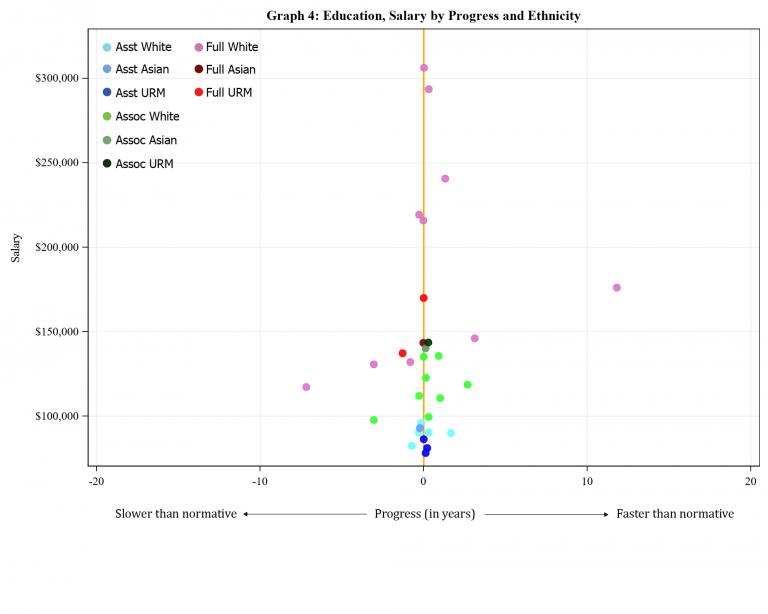
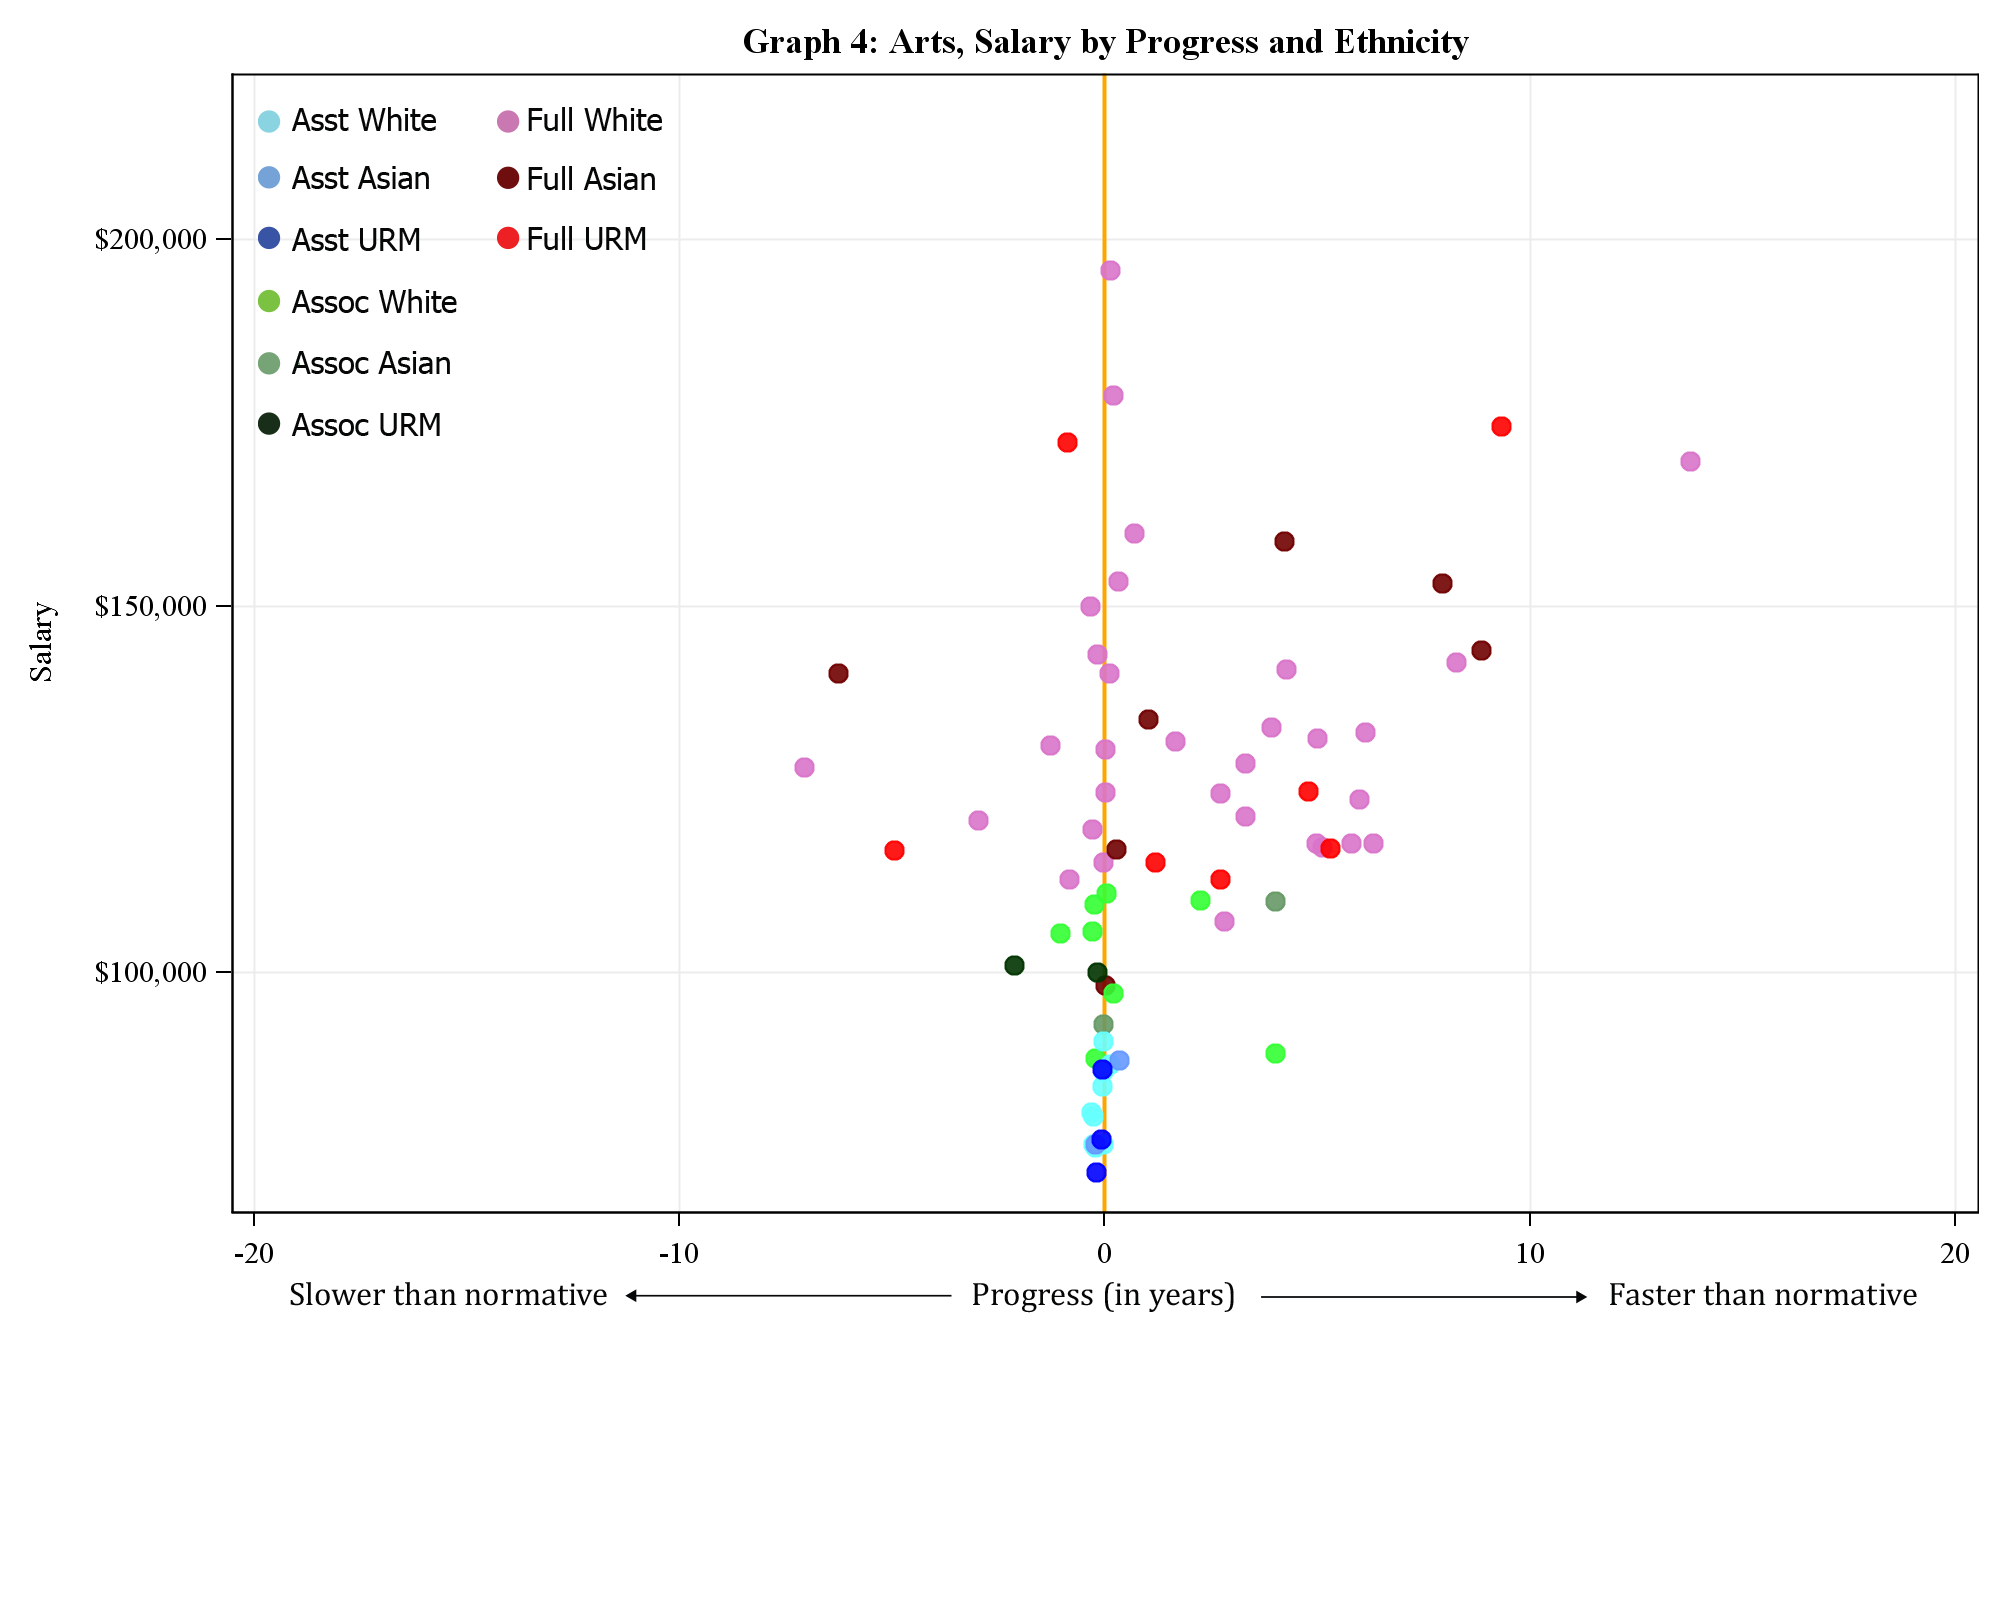
As a function of rank, step, and ethnicity:
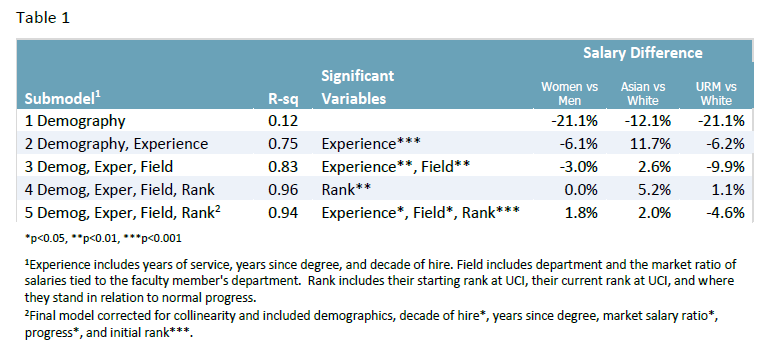
Multiple Linear Regression Analysis
Multiple regression analysis of salary vs rank/step. As indicated in Table 1, simplest model with only demographic variables shows that relative to white male faculty, women earn salaries that are 21% lower, Asian faculty 12% and URM faculty 21% lower. Only 12% of salary variation is explained by this model. After all control factors are added, 94% of salary variation is explained by a model with demographic, experience, field, and rank variables. After adjusting for covariates, relative to white male faculty, salaries are 1.8% higher for faculty who are women, 2% higher for Asian, and 4.6% lower for URM faculty. This model also shows demographic variables are not statistically significant.
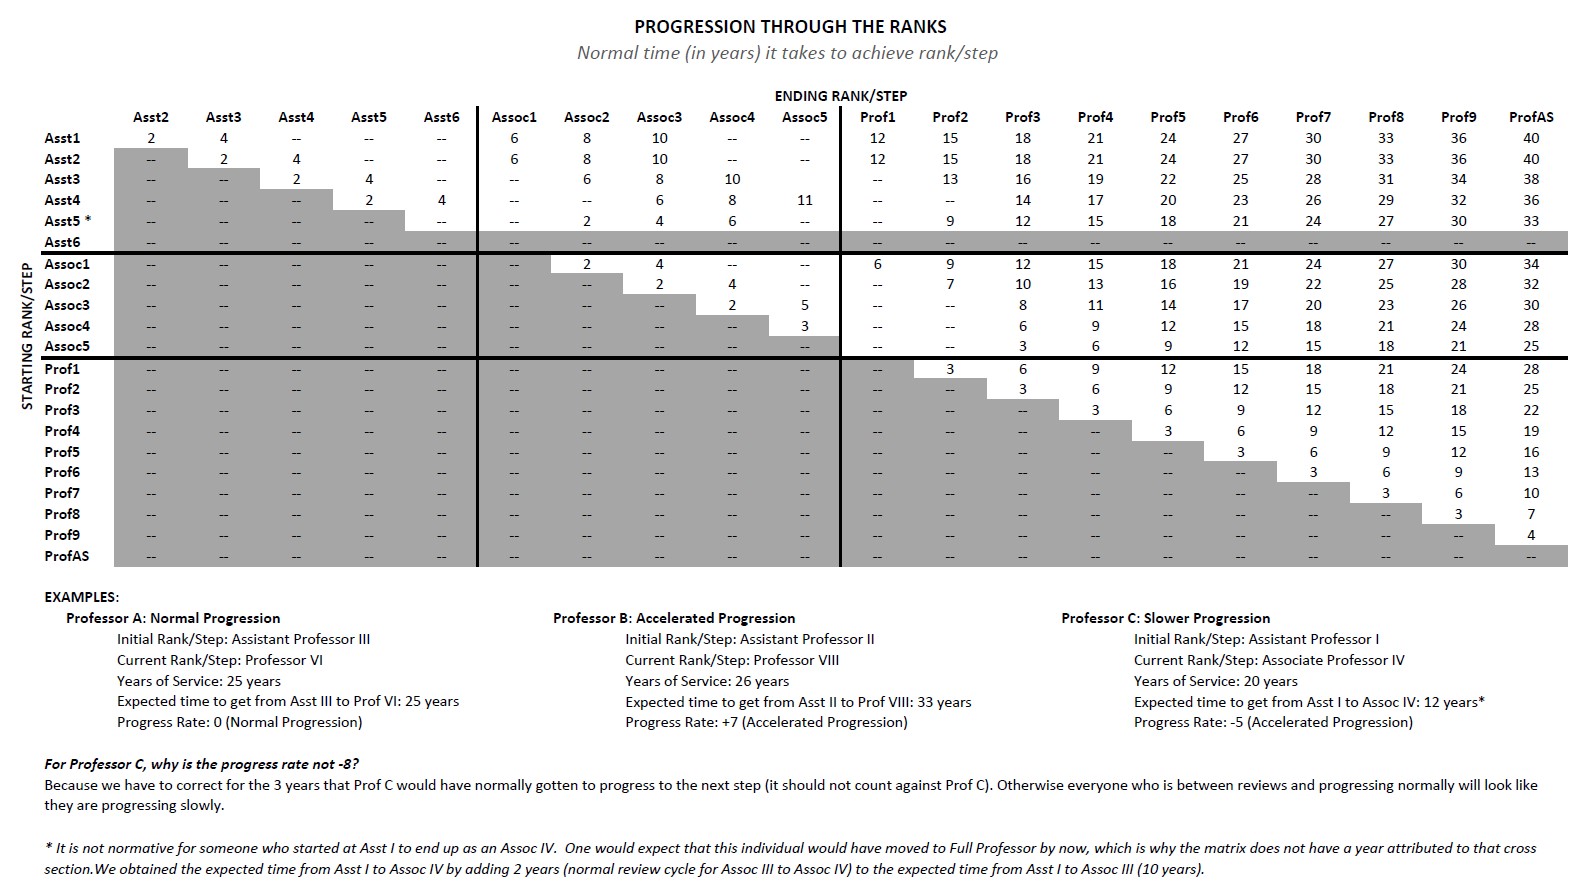
Progression Analysis
The progression data for all Education Ladder Rank Faculty, are plotted below. Normative progression is defined in the Progression Matrix.
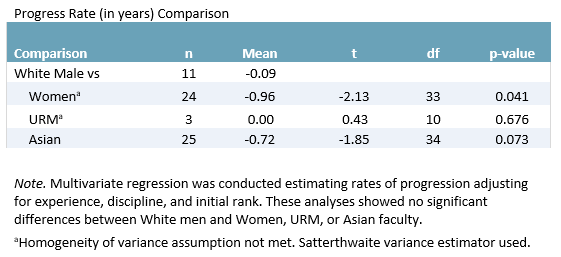
Progress Rate Analysis
Using a simple t-test, results indicate that there is no statistically significant difference in progression rate means by either gender or ethnicity when compared to white male faculty. Normative progression is defined in the Progression Matrix.