Ladder Rank Salary Data
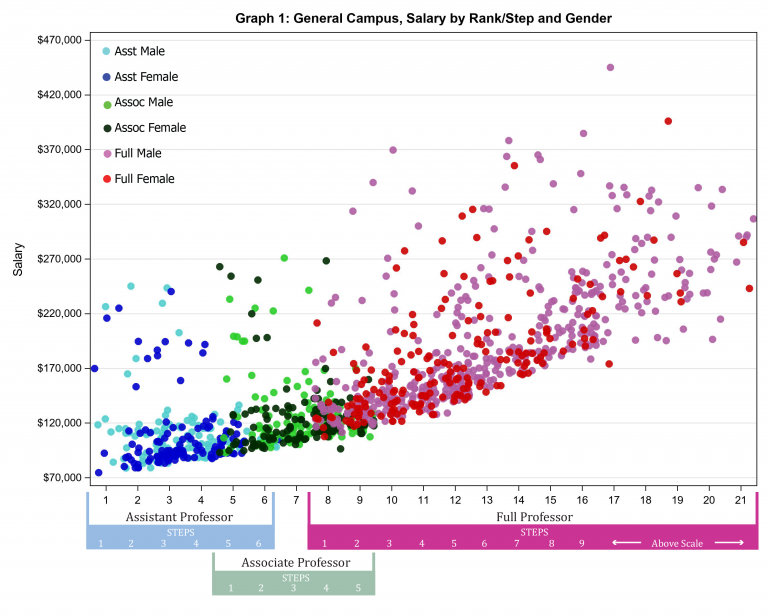
The salary data for all Ladder Rank Faculty on the General Campus are plotted below.
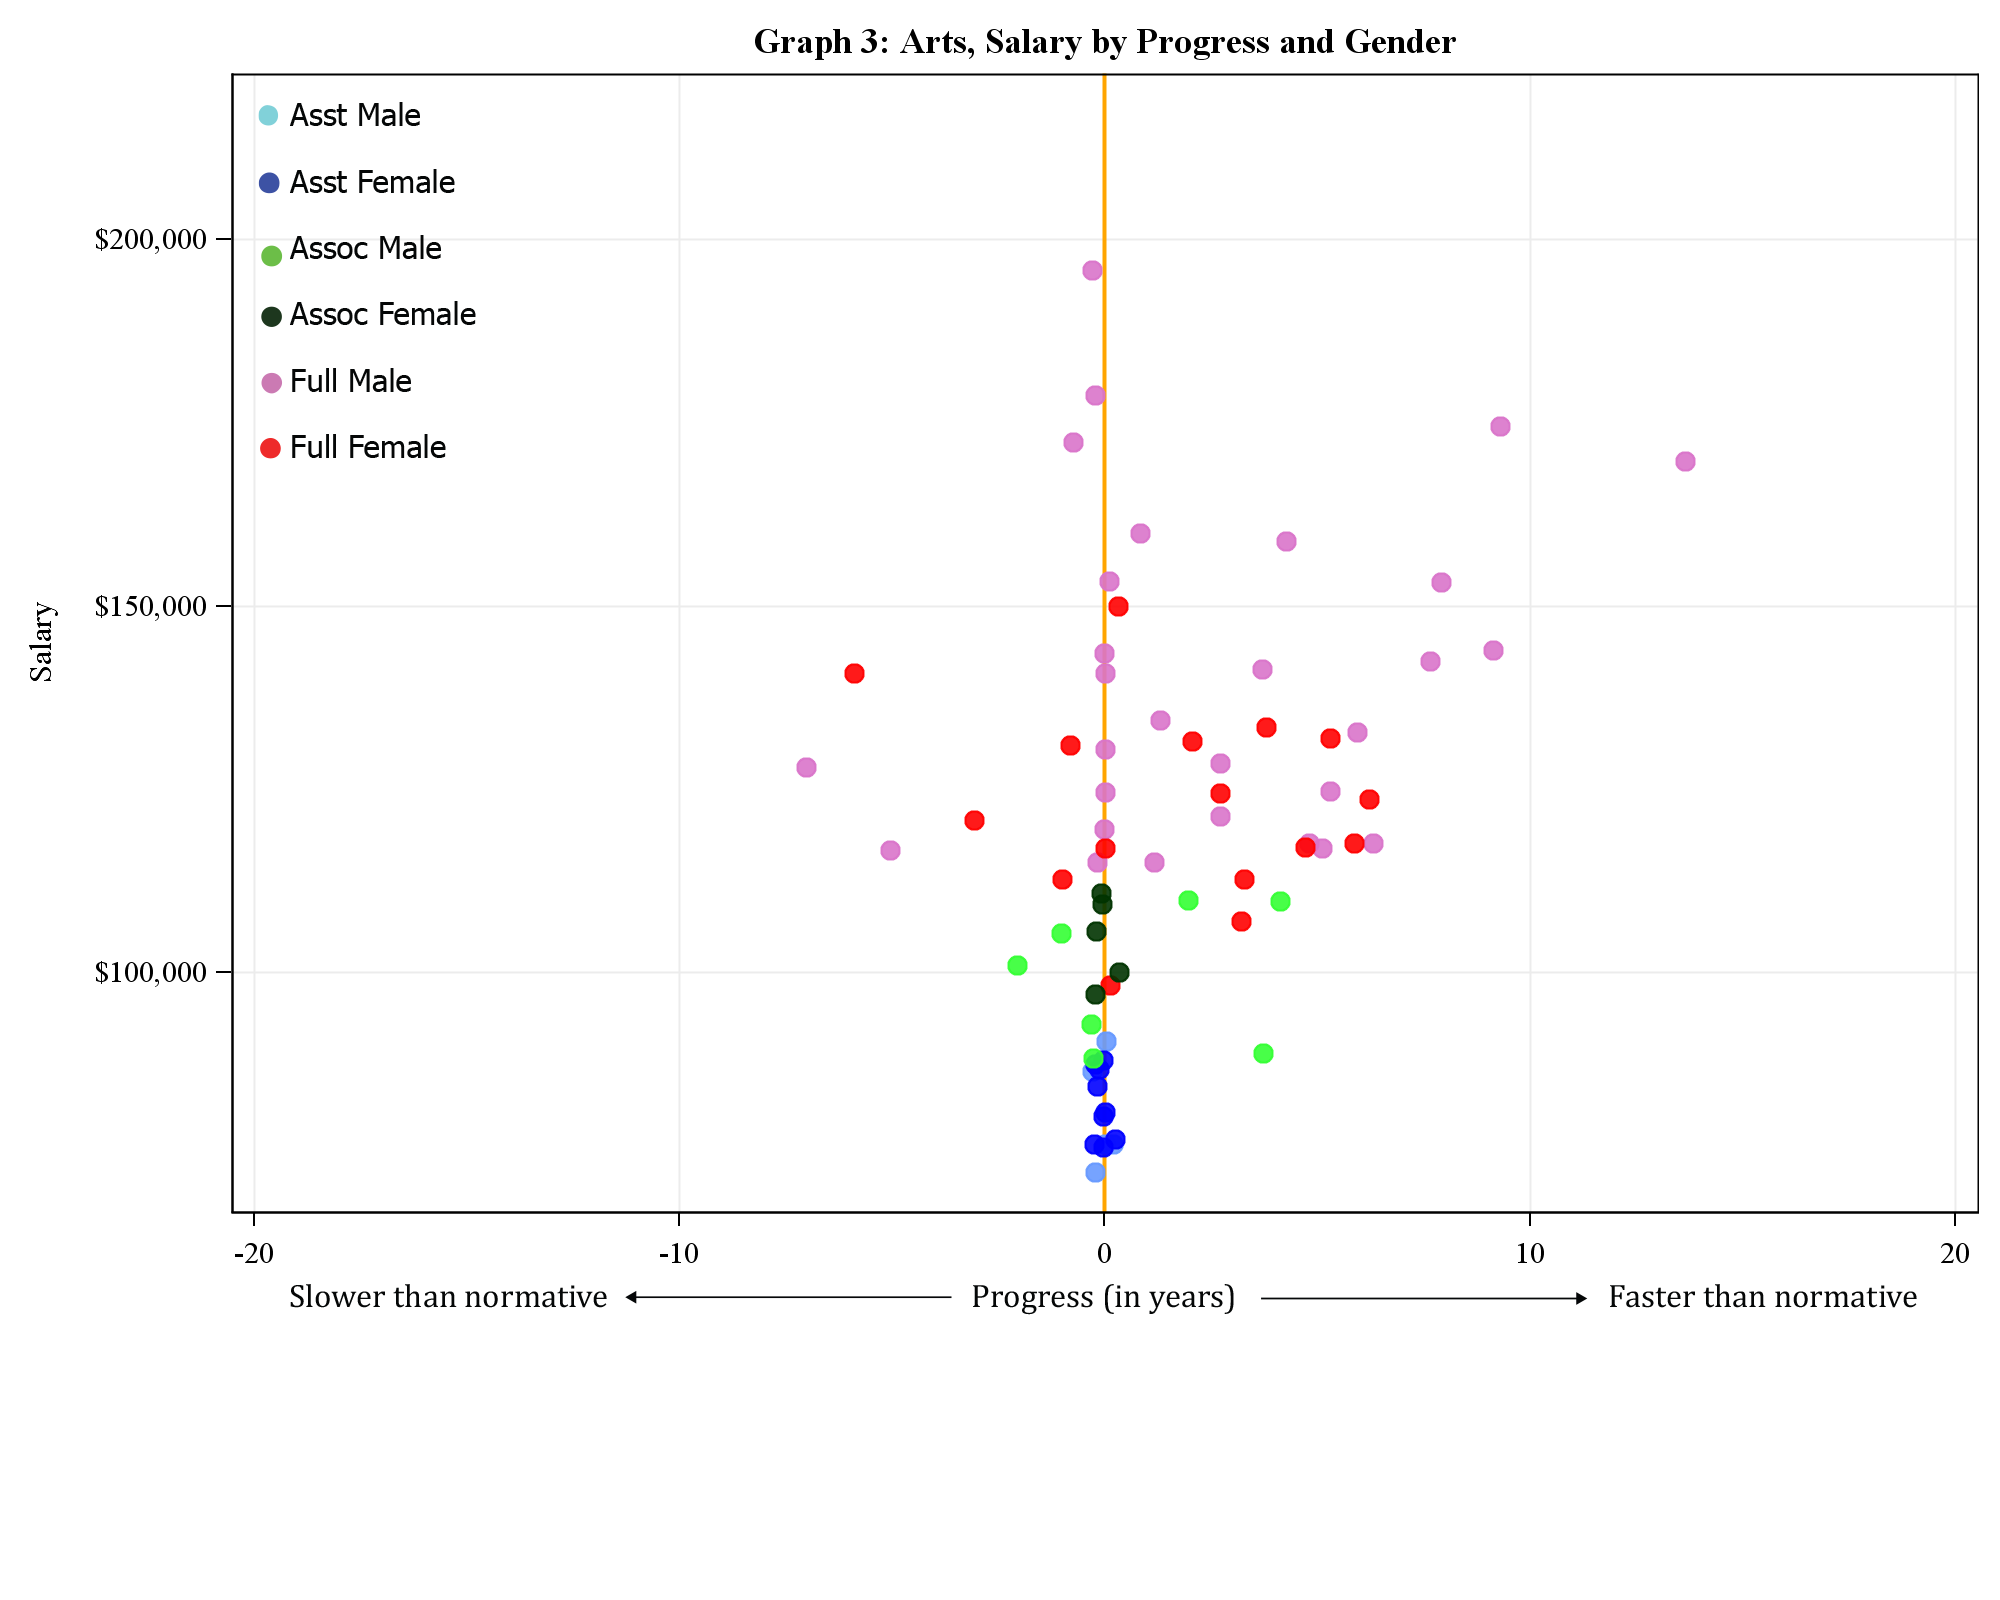
As a function of rank, step, and gender:
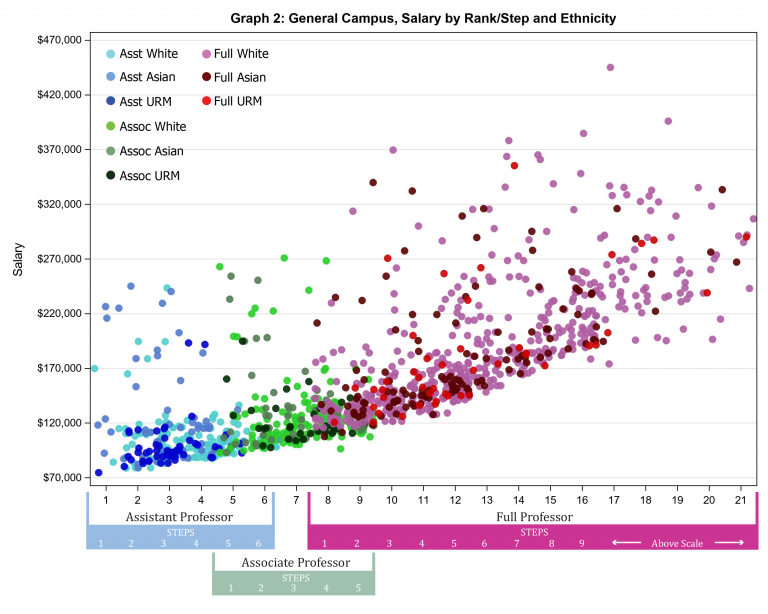
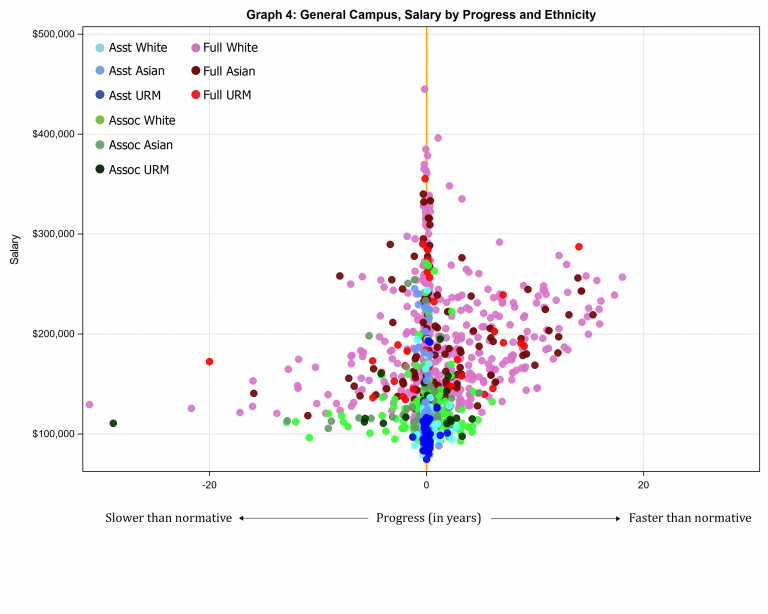
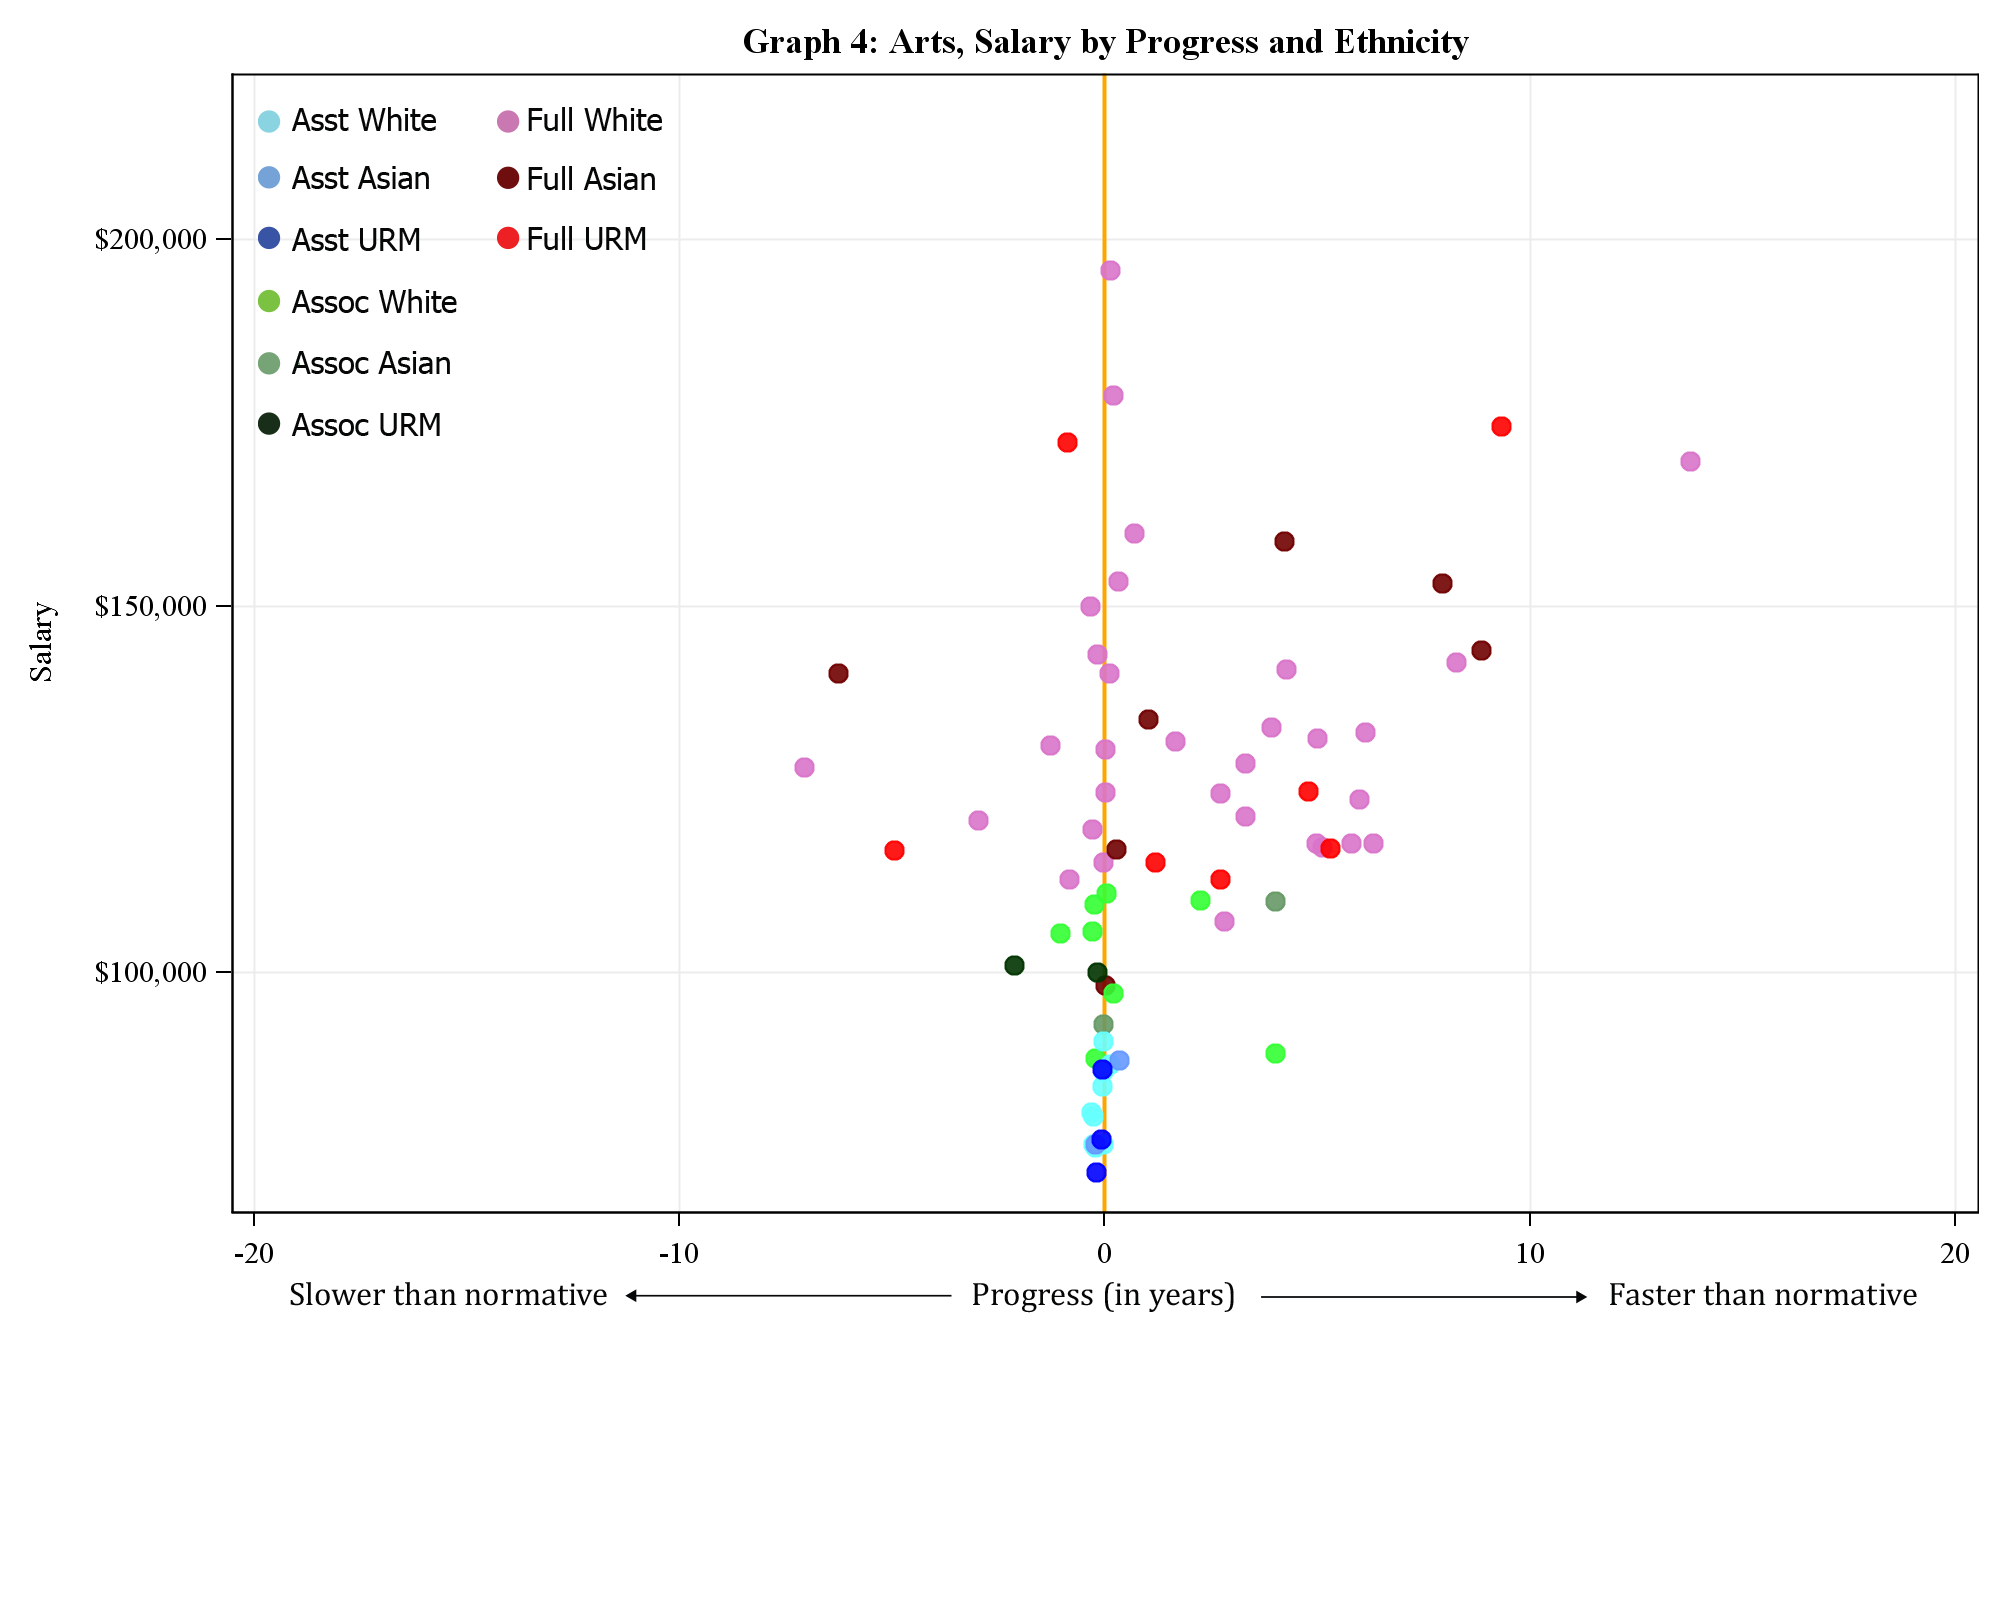
As a function of rank, step, and ethnicity:
Multiple Linear Regression Analysis
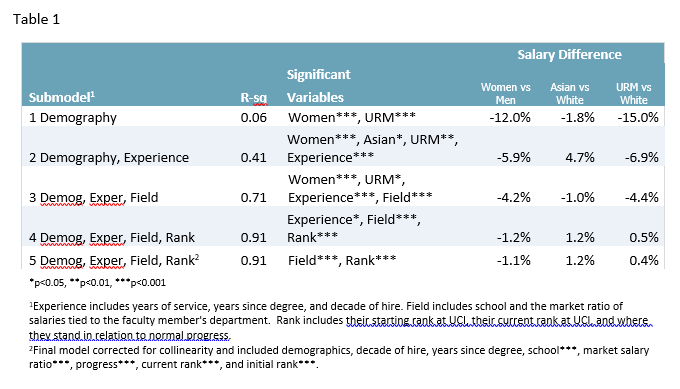
When these data are evaluated with the simplest model that includes only demographic variables the result indicate that, compared to their colleagues who are male, women earn salaries that are 12% lower, Asian faculty 1.8% lower, and URM faculty 15.% lower. However, only 6% of the salary variation is explained by the model (Table 1). As additional explanatory variables are added to the model, salary differences diminish to approximately 1% or less between women, Asian, and URM faculty when compared to white men; and the percentage of salary variation explained by the model increases to 91%. This indicates that at the campus level, there is little evidence of salary inequity associated with gender and/or ethnicity.
Progression Analysis
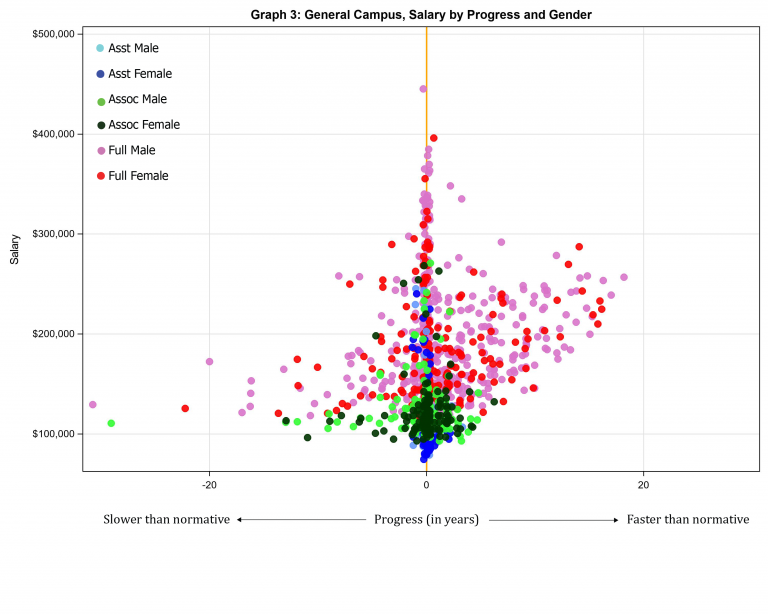
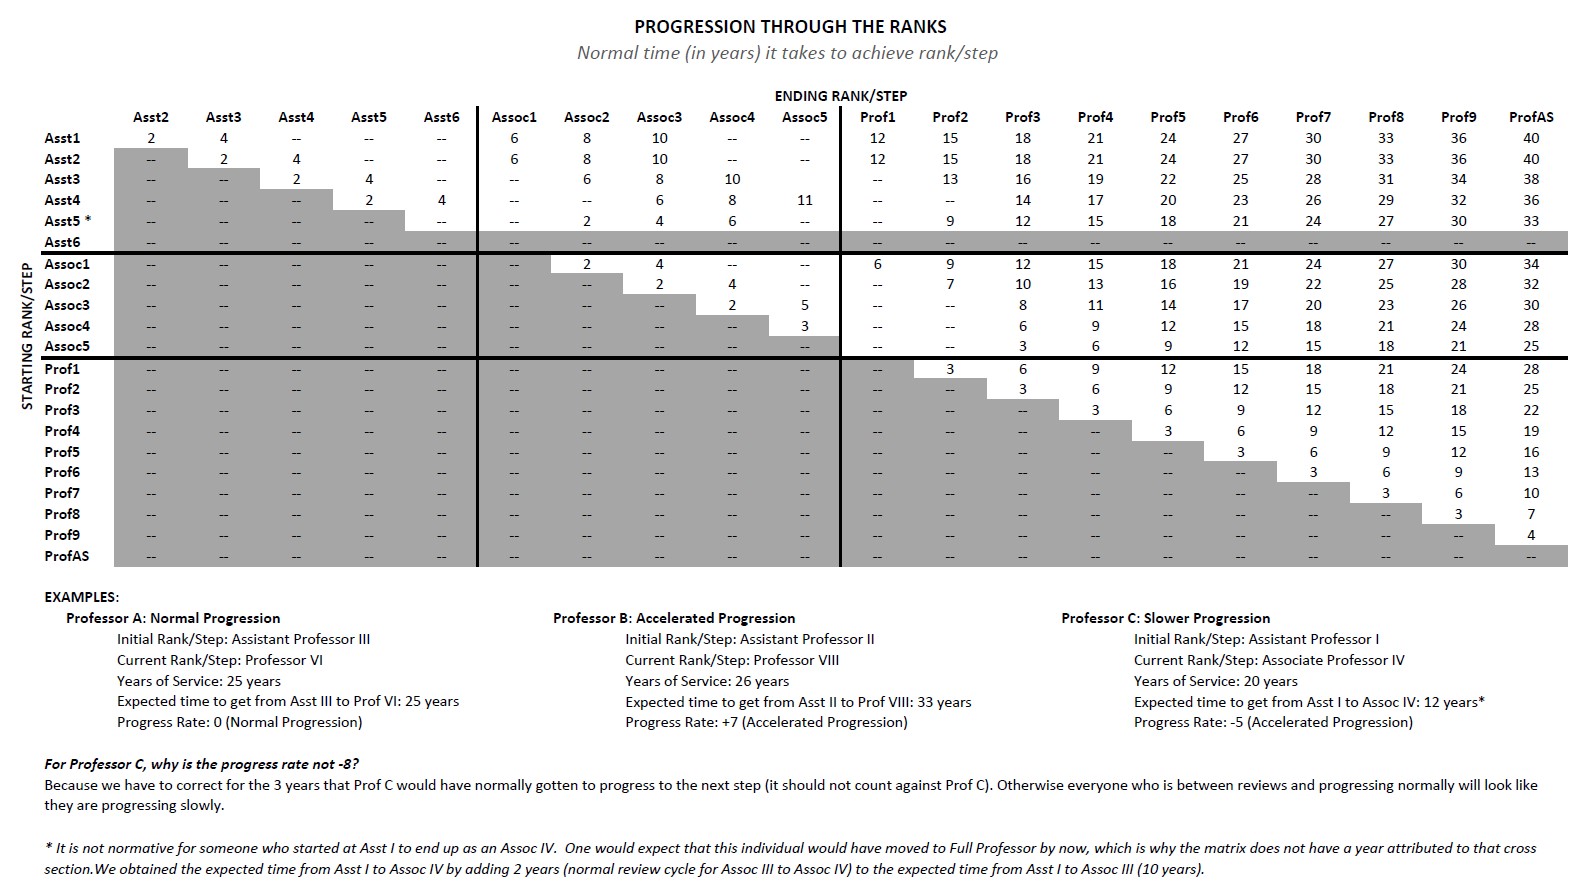
The progression data for all General Campus Ladder Rank Faculty, are plotted below. Normative progression is defined in the Progression Matrix.
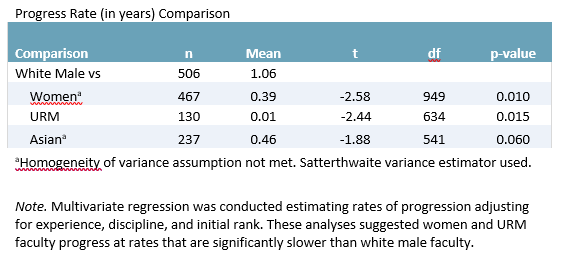
Progress Rate Analysis
There has been debate on whether rank should be included in predicting salary. In previous studies, rank is generally included in predictive modeling unless there is evidence of bias against one group progressing through the ranks. Cursory t-tests on the rate of progression indicate there is no statistically significant difference in progression rate means by Asian and White male faculty. However, women faculty on average advanced at a rate that was 0.67 years and URM faculty 1.05 years slower than White men. After using multivariate regression to adjust for experience, discipline, and initial rank, there was no statistically significant difference in rates of progression between White and Asian faculty. Women progressed at a statistically significant slower rate than men (b = -0.51, p = 0.039), and URM faculty progressed at a statistically significant slower rate than White faculty (b = -0.87, p = 0.021).
This is the first year with statistically significant differences in rates of progress between White male faculty and other demographic groups. As this is the first year we are including Professors of Teaching, we ran analyses both with and without Professors of Teaching. When the Professors of Teaching were excluded, difference between White males and other demographic groups were not statistically significant. However, the average magnitude of differences was roughly the same, suggesting that the lack of statistical significance was likely due to the decreased sample size not the addition of the Professors of Teaching.
For the sake of consistency in comparing results year over year, finalized salary regression models will maintain the same variables as previous years (which includes current rank and step for most schools) while we further explore the reasons behind these differences and possible mitigating steps if appropriate. Normative progression is defined in the Progression Matrix.
School Level
Analyses at the school level yield a range of results. When controlling for experience, department within the school, and rank, salary differences are, for the most part, similar to that of the campus as a whole, but there are exceptions. Some units show statistically significant higher salaries for minority groups relative to white faculty, whereas other units show no statistically significant differences between ethnicities or genders. One school does show a statistically significant lower salary for women relative to men that is being studied further. Known limitations to the current analysis are that data on “Stop the Clock” are not readily available nor was there enough data to consistently address the impact of outside offers.
General Campus Summary
In summary, we found no evidence for systemic inequity in salary associated with gender and/or ethnicity among faculty at the campus level. However this study does highlight several areas for further evaluation including understanding factors contributing to low representation of women and minority faculty in the higher ranks and steps. The study showed that women and URM faculty progressed through the ranks at somewhat slower rates than White male faculty. Further analysis is needed to examine potential explanations of these trends and appropriate remediation.