Ladder Rank Salary Data
As a function of rank, step, and gender:
As a function of rank, step, and ethnicity:
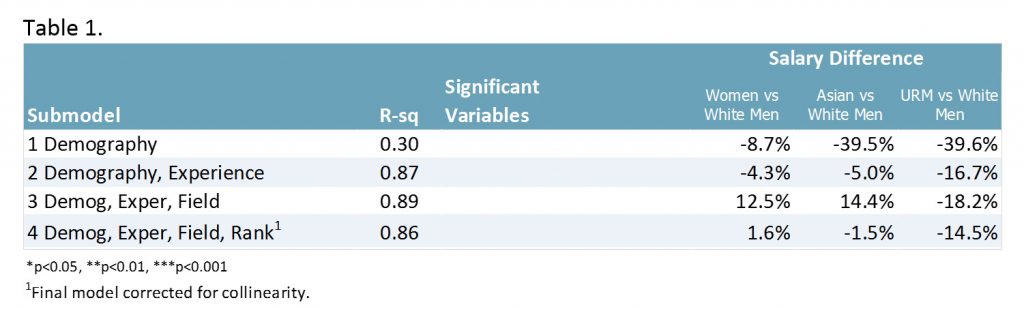
Multiple Linear Regression Analysis
Multiple regression analysis of salary vs rank/step. As indicated in Table 1, the simplest model with only demographic variables shows women earn salaries that are 9% lower, Asian and URM faculty earn 40% less, respectively, compared to their colleagues who are white and male. Thirty percent of salary variation is explained by this model. As control factors are added to the model, salary differences change with women earning 2% more, Asian faculty earn 2% less, and URM faculty earn 15% less, compared to white male faculty. The percentage of salary variation explained by the model increases to 86%.
Progression Analysis
The progression data for all Pharmaceutical Sciences Ladder Rank Faculty, are plotted below. Normative progression is defined in the Progression Matrix.
Progress by gender:

Progress by ethnicity:

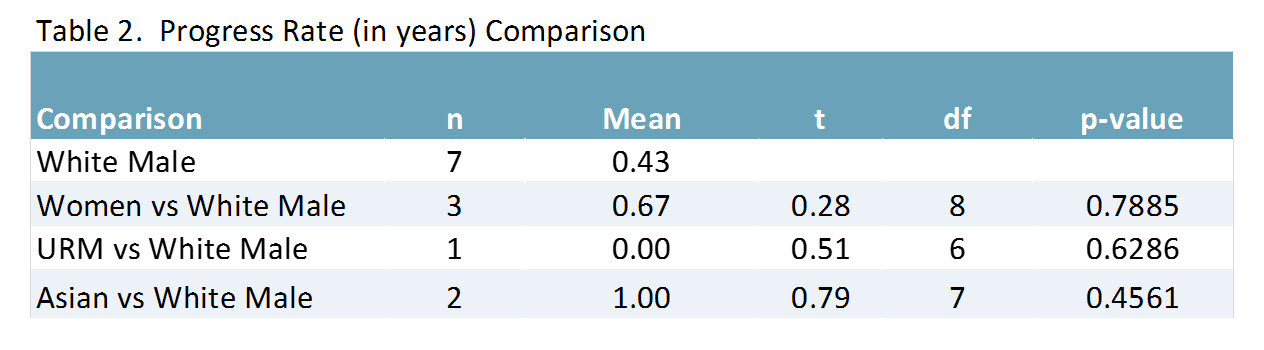
Progress Rate Analysis
The results indicate there isn’t a statistically significant difference in progression rate means by either gender or ethnicity when compared to white male faculty, indicating there is no evidence of biases against promotion. Normative progression is defined in the Progression Matrix.