Ladder Rank Salary Data
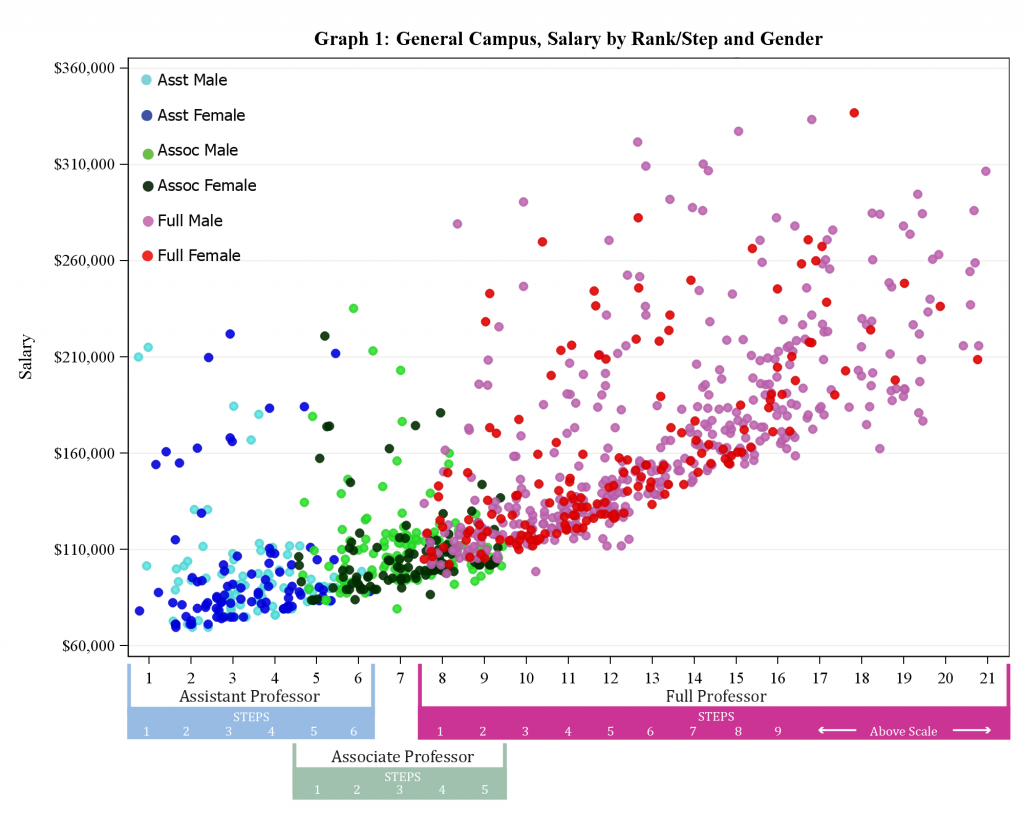
As a function of rank, step, and gender:
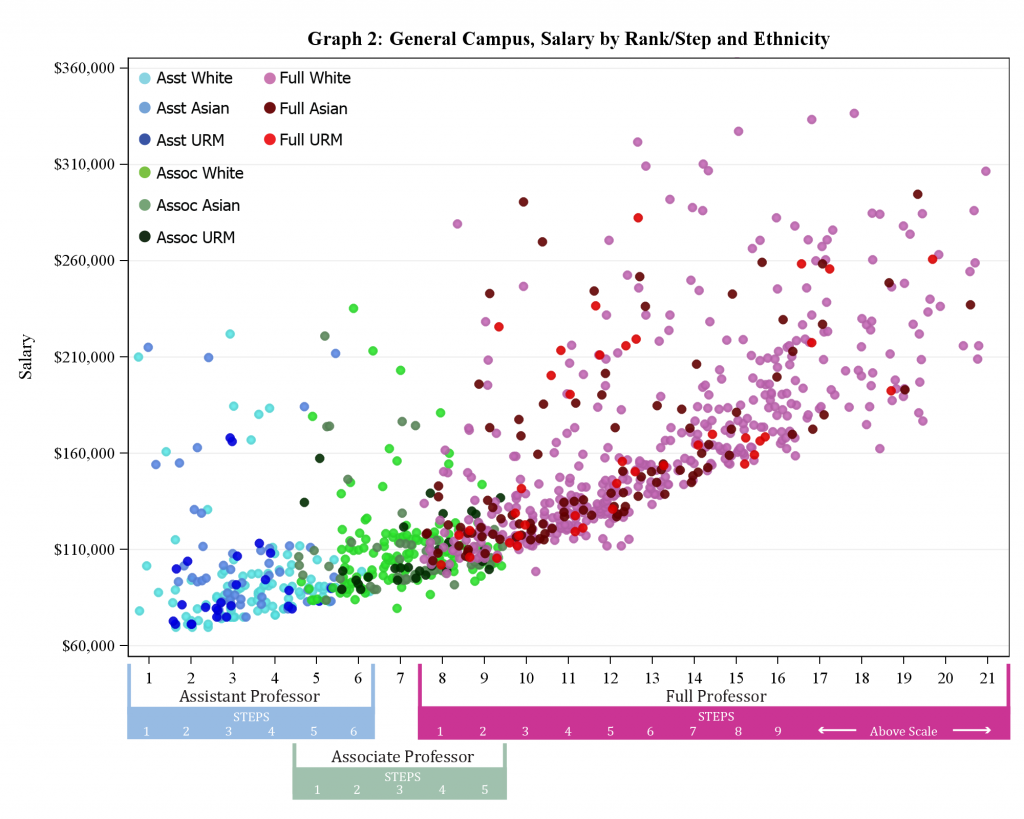
As a function of rank, step, and ethnicity:
Multiple Linear Regression Analysis
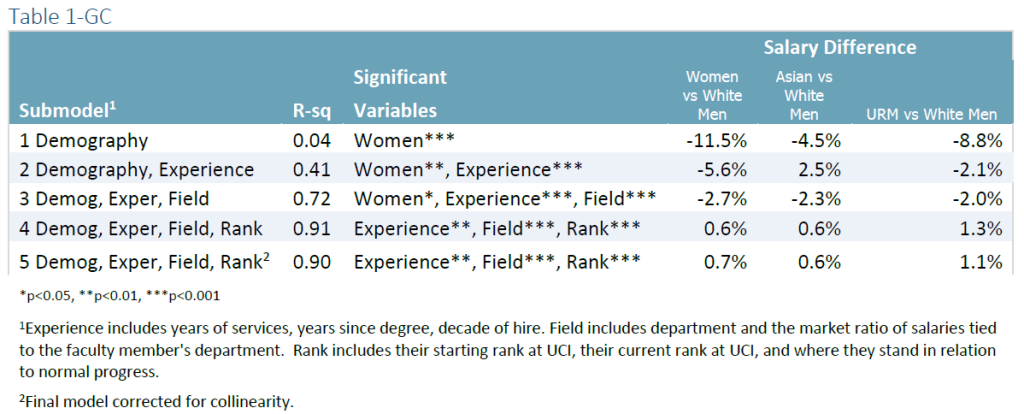
When these data are evaluated with the simplest model that includes only demographic variables the result indicate that women earn salaries that are 12% lower, compared to their colleagues who are white and male, but only 4% of the salary variation is explained by the model (Table 1-GC). As additional explanatory variables are added to the model, the percent of salary variation explained by the model increases to 91%; and salary differences diminish to less than 1% between women, Asian, and URMs compared to white men. This indicates that at the campus level, there is little evidence of salary inequity associated with gender and/or ethnicity.
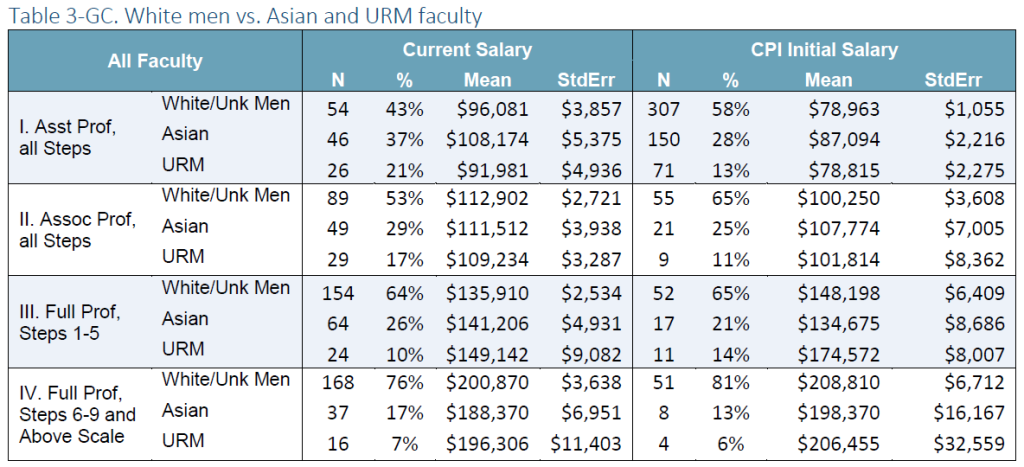
Rank and Step Distribution Analysis
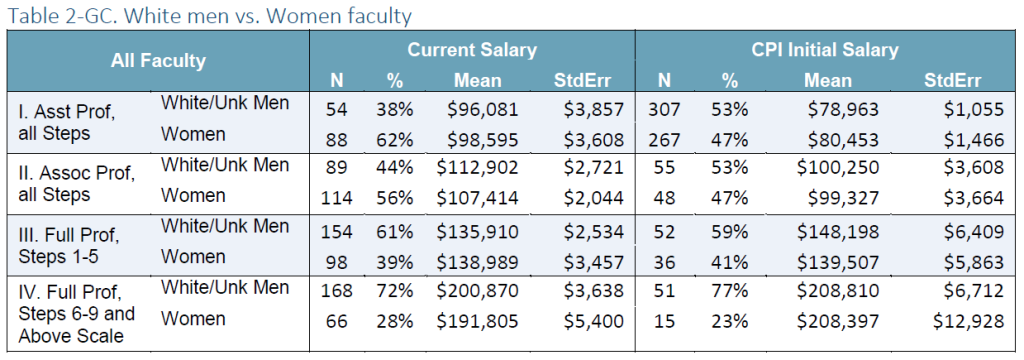
When controlling for rank and step, regression analyses show salaries are similar by demographic variables at the time of hire as well. The distribution of faculty among ranks both currently and at time of hire is displayed in Table 2-GC and Table 3-GC. The tables reveal women and minorities predominately begin in the lower ranks while the ranks in which white men begin is more evenly dispersed. The current rank for white men is also normally distributed while the distribution for others are skewed to the right.
Progression Analysis
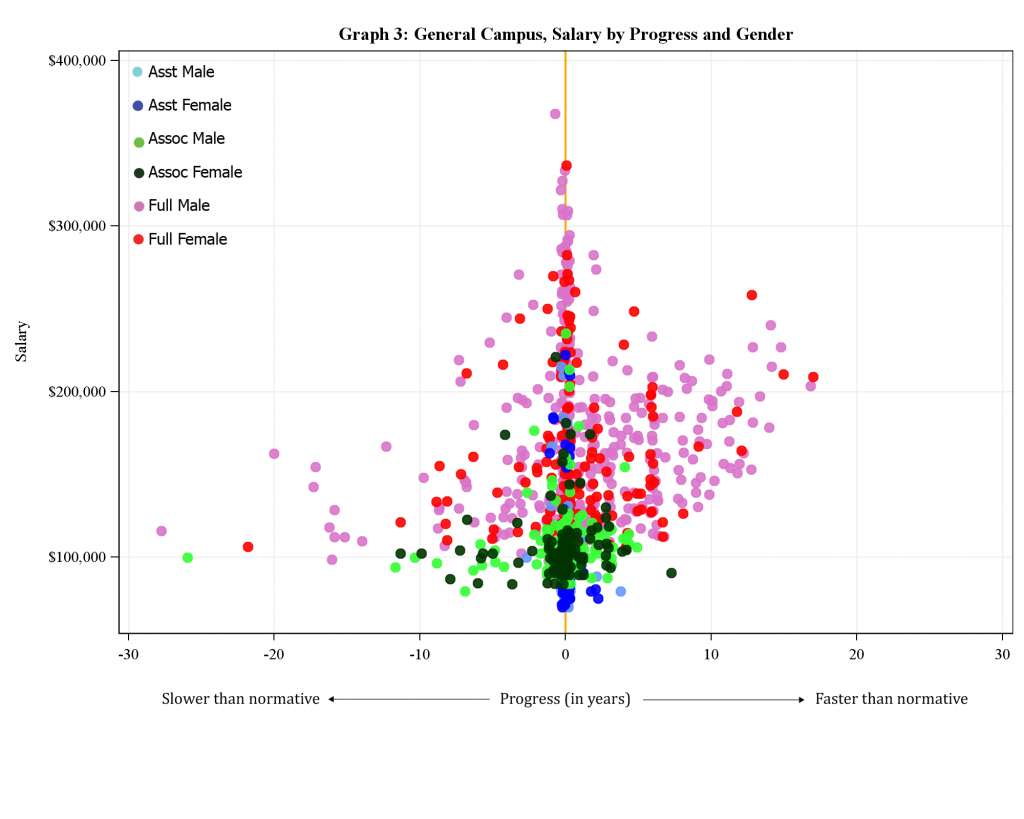
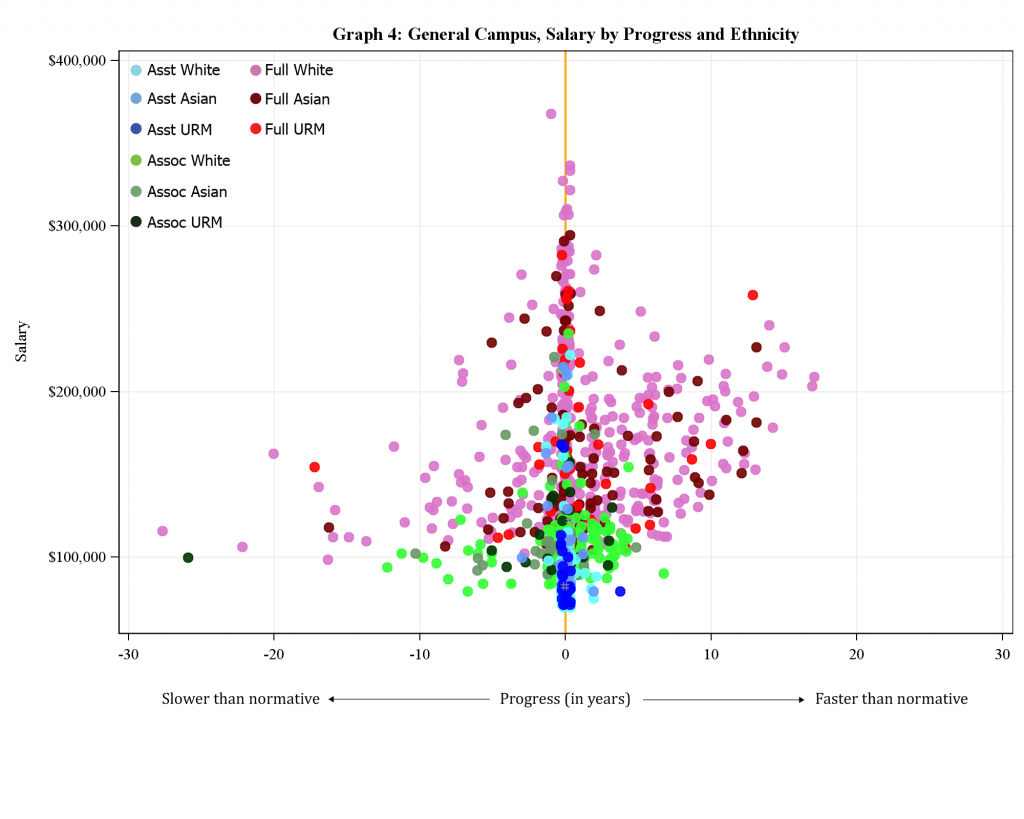
The progression data for all General Campus Ladder Rank Faculty, are plotted below. Normative progression is defined in the Progression Matrix.
Progress by gender:
Progress by ethnicity:
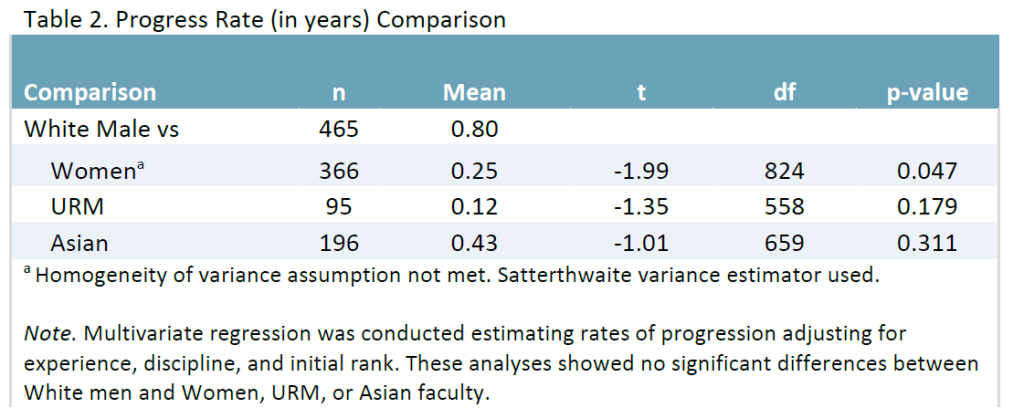
Progress Rate Analysis
Using a simple t-test, the progression rate for women is 0.55 years slower than white men (0.25 vs. 0.80, respectively; t(824) = -1.99, p = 0.047 using Satterthwaite variance estimator due to a lack of homogeneity of variance). Whereas URM and Asian faculty also progressed at a rate slower than white men (0.12 and 0.43 vs. 0.80, respectively), these differences was not statistically significant (URM vs white male t(558) = -1.35, p = 0.179; Asian vs. white male t(659) = -1.01, p = 0.311). Using multivariate regression in order to statistically adjust for experience, discipline, and initial rank, the rates of progression of female, URM, and Asian faculty were not significantly different than white male faculty (all p’s > 0.05). Normative progression is defined in the Progression Matrix.
School Level
Analyses at the school level yield a range of results. When controlling for experience, department within the school, and rank, salary differences are, for the most part, similar to that of the campus as a whole, but there are exceptions. Some units show statistically significant lower salaries for women and minority groups while the opposite holds true in other units. Known limitations to the current analysis are that data on “Stop the Clock” was not readily available nor was there enough data to consistently address the impact of outside offers.
General Campus Summary
We found no evidence for systemic inequity in salary associated with gender and/or ethnicity among faculty at the campus level. However this study does highlight several areas for further evaluation including understanding factors contributing to low representation of women and minority faculty in the higher ranks and steps. Progression rates through the ranks should also be further examined. Although, overall progression rates are similar for all faculty, there were outliers and evidence to suggest that groups of faculty in specific academic units may benefit from intervention to help them progress through the ranks and steps.